How To Measure AI Search Visibility: The Complete Tracking Guide (When Google Analytics Hides 70% of AI Traffic)
1. The AI Attribution Problem: Why Your Analytics Are Lying
Your Google Analytics dashboard is telling you a story that’s only 30% true.
When visitors arrive at your website through AI-powered search results—whether from Google’s AI Overviews, ChatGPT, Claude, or Perplexity—70% of that traffic gets classified as “direct” or “organic” in GA4. It’s invisible. Unattributable. Lost in the noise of referral data that hasn’t caught up with how search actually works in 2026.
This isn’t a bug in Google Analytics. It’s a fundamental gap between how people find information and how attribution tools were designed to track it. Traditional SEO metrics—keyword rankings, click-through rates, referral traffic—were built for a world where organic search meant clicking a blue link from a SERP. That world still exists, but it’s no longer the only game.
The Three Attribution Blindspots
Blindspot #1: Google Search Console doesn’t separate AI Overview metrics.
When Google serves your content in an AI Overview or other generative result, it counts as an impression. But GSC doesn’t tell you which impressions come from traditional SERPs and which come from AI. You see the aggregate. You can infer based on changes, but you can’t measure directly.
Blindspot #2: Citation value is invisible.
When your article gets cited in an AI answer—but not clicked—it never appears in your referral traffic. You receive no attribution for that visibility. Yet citations drive brand awareness, build authority, and generate long-term traffic through other channels. Understanding answer engine optimization helps you optimize specifically for these citation opportunities. Traditional metrics miss all of it.
Blindspot #3: The metrics that mattered are becoming less relevant.
In a world where AI answers pull from multiple sources at once, “ranking #1” means less than “being cited.” Click-through rate becomes a secondary metric when users get their answer without clicking anything. Impressions matter more than clicks because impressions are where visibility happens—cited or not.
The New Reality: Impressions and Citations Are Your New KPIs
This shift requires a new measurement framework. Not to replace traditional SEO metrics, but to complement them. You need to know:
- How often your content is cited in AI answers for your target queries
- What percentage of AI-generated answers include your brand (Generative Share of Voice)
- Whether you’re in the visible section of an AI answer or buried in “Show more”
- How much traffic comes from these citations (even when it looks like “direct”)
- How your competitive position has shifted in AI-powered search
| What GA4 Shows | What’s Actually Happening | Business Impact |
|---|---|---|
| “Direct” traffic spike | AI Overview citation bringing referral traffic | You’re undervaluing content that actually drives visits |
| No referral data for Perplexity, Claude, ChatGPT | Hundreds of citations per month across AI platforms | You have no visibility into a major traffic channel |
| Impression spikes without click increases | Content is being served in AI Overviews | You’re losing visibility without realizing it |
| New queries in GSC you don’t rank for | Being cited for queries you don’t own | Opportunity to optimize for new audience segments |
| Declining CTR on a top-ranking page | AI Overviews are answering the query instead | Need to change content strategy, not something’s wrong |
| No data on brand mentions | Brand being discussed in AI answers without links | Missing authority-building and awareness metrics |
2. The New Metrics Framework for AI Search Visibility
Just as traditional SEO created a standard vocabulary around keyword rankings, click-through rates, and impressions, AI search visibility needs its own measurement language. Here’s the framework you need to adopt.
Key Metrics Defined
- Generative Share of Voice (GSoV): The percentage of target queries where your brand is cited in AI-generated answers. If you target 100 keywords and your brand appears in AI answers for 34 of them, your GSoV is 34%. Learn more in our generative engine optimization guide.
- AI Citation Rate: The number of times your content is cited across AI platforms in a given period, broken down by platform and topic.
- Impression Quality: The distinction between impressions where you’re directly cited versus impressions where you appear only in supporting data. An AI Overview that mentions your brand by name is higher quality than an answer that pulls data from your content without attribution.
- Citation Position: Whether your citation appears in the initially visible portion of an AI answer (the first 2-3 sources) or in “Show more” sections. Position correlates strongly with user attention and click-through.
- Brand Mention Frequency: How often your brand name appears in AI-generated answers, even without direct citations. This soft metric indicates authority and market presence.
- AI Referral Quality: The conversion rate and average session duration for traffic attributed to AI sources, compared to traditional organic traffic. This answers whether AI-referred visitors are qualified.
| Metric | Definition | Why It Matters | How to Track | Target Benchmark |
|---|---|---|---|---|
| GSoV | % of target queries with brand citations in AI answers | Indicates market presence in generative results | Manual SERP checks + third-party tools (Ahrefs, Gauge) | 35-50% for competitive markets |
| Citation Rate | Total monthly citations across AI platforms | Measures content consumption and authority | Brand Radar, Scrunch, manual monitoring | 20-100+ per month depending on industry |
| Impression Quality | % of AI impressions with direct brand mention | Higher quality = more visibility and brand recognition | Segment GSC data + third-party tools | 60%+ direct mentions vs. attribution only |
| Citation Position | % of citations in visible vs. “Show more” sections | Position correlates with click-through and user attention | Manual checks + Gauge platform | 70%+ in visible section |
| Brand Mentions | Total brand name appearances in AI answers | Soft metric of authority and market positioning | Google Alerts + social listening tools | Contextual—track trend vs. prior month |
| AI Referral Quality | Conversion rate + avg session duration from AI traffic | Determines whether citations drive qualified visitors | GA4 custom segments + UTM parameters | Within 10% of organic average |
3. Manual SERP Checking: The Foundation
Before you layer on third-party tools and custom dashboards, you need a manual SERP checking system. Why? Because this is the most reliable, most direct way to see what’s actually happening with your content in AI-powered search results.
Automated tools have limitations. They can miss nuances, misclassify citations, or go out of sync with reality. Manual checks ground you in what’s real. They also help you understand the “why” behind the metrics—the patterns and positioning that numbers alone won’t reveal.
Setting Up Your Manual Tracking Process
- Identify your target keyword set.
Start with your top 20-30 keywords. These should include high-volume keywords, branded queries, and topic-cluster head terms. Don’t try to track 500 keywords manually—that’s what tools are for. - Create a tracking spreadsheet.
Columns should include: (a) Keyword, (b) Date of check, (c) AI Overview present (yes/no), (d) Your brand cited (yes/no), (e) Citation position (visible/show more/not present), (f) Competitor citations, (g) Notes/opportunities. - Establish a checking cadence.
For top-priority keywords, check weekly. For secondary keywords, bi-weekly. Document everything consistently. The value comes from trending these changes over time. - Use VPN for geographic variation.
AI Overviews vary by location, device, and search history. If you serve multiple geographies, rotate through 3-4 different locations to see how your visibility changes. Document geography for each check. - Clear your search history.
Search with a fresh profile or incognito mode. Your personal search history affects what appears in AI Overviews. You want to see what the average user sees, not your personalized view. - Document everything.
Don’t just mark “yes” or “no”—capture which source is cited, in what order, and what portion of the answer it represents. Screenshots are invaluable for seeing how your position changes month-to-month.
Manual SERP Tracking Spreadsheet Structure
Columns:
- Keyword
- Target Position (where you want to rank)
- Check Date
- Geography
- Device Type
- AI Overview Present?
- Your Brand Cited?
- Citation Position (Visible / Show More / Not Present)
- Your Traditional Rank (1-100)
- Competitor #1 Cited?
- Competitor #2 Cited?
- Competitor #3 Cited?
- Content Type Cited (Article / Review / Comparison / Other)
- Screenshot (Y/N)
- Notes
Track this weekly for top 20 keywords; bi-weekly for secondary keywords.
The data reveals patterns about which content types AI prefers, which competitors dominate, and where opportunities exist.
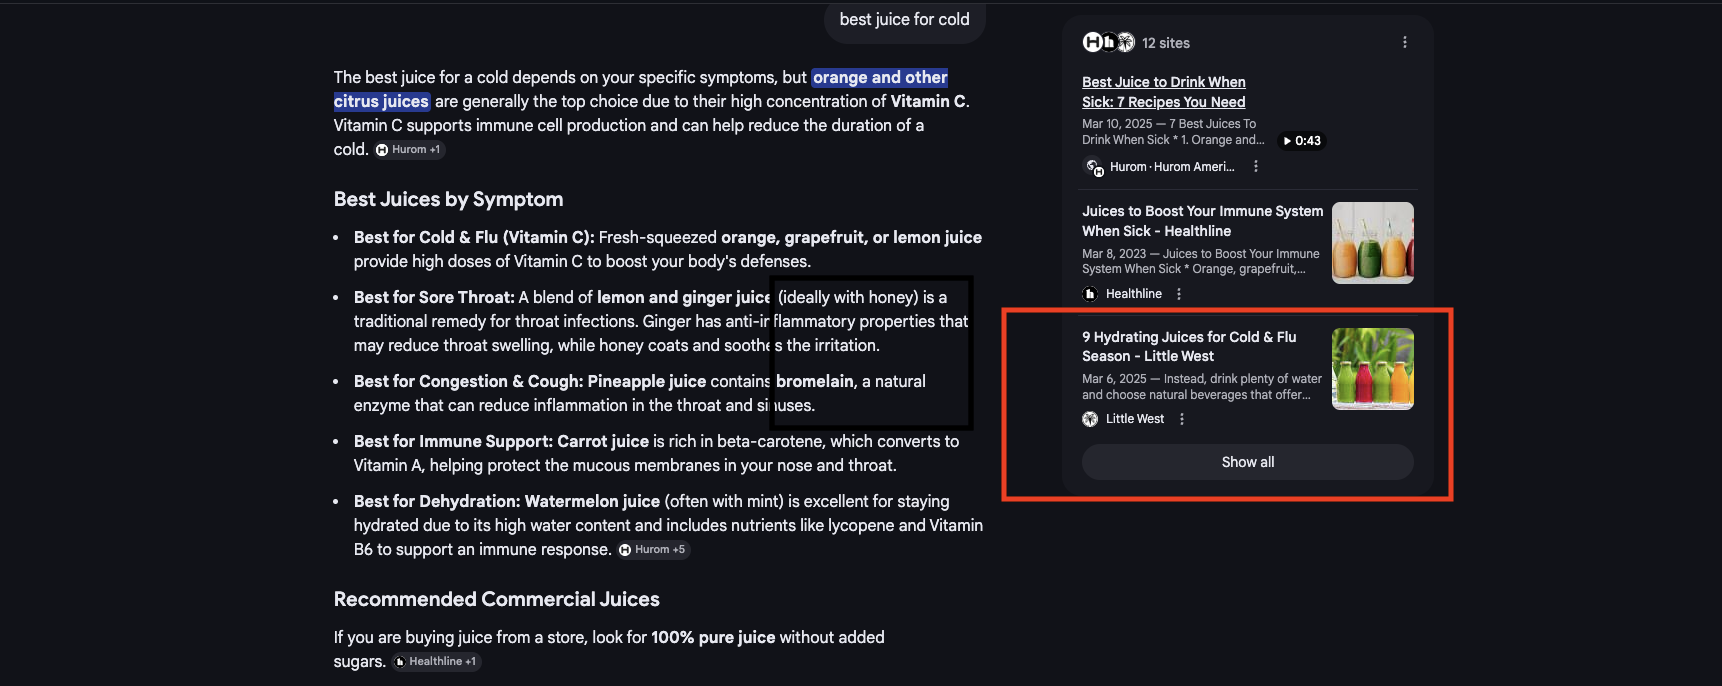
Manual SERP Tracking in Action: Little West Example
For a keyword like “best juice for a cold” (250 monthly volume), Little West’s tracking would capture:
- Date: 2026-03-20
- AI Overview Present? Yes
- Your Position in Overview: Position 2, visible in main answer
- Traditional Rank: Position 2 (same as AI citation position)
- Competitors Cited: Competitor A (pos 1), Competitor B (not cited in overview)
- Content Type Cited: Article (health benefits content)
- Screenshot: Yes
Week-over-week tracking of this single keyword reveals: “Is our position in the AI Overview stable? Do competitors appear/disappear? When does our content get cited vs. competitors?” This pattern across 20+ keywords builds your measurement foundation.
What to Document
Each weekly check should capture:
- Query and AI Overview presence: Is there an AI Overview for this query, or is Google still testing/rolling it out?
- Cited sources and order: Who’s cited, and in what sequence? First citations get more visibility.
- Your position: Both in the AI answer (if cited) and in traditional organic results below.
- Competitor citations: Which competitors are cited, where, and how frequently across your tracked keywords?
- Content type correlation: Is the cited content a how-to article, data report, case study, or listicle? This reveals what formats AI prefers for different query types.
Weekly for top 20 keywords (1-2 hours/week). This gives you monthly trends, seasonal patterns, and early warning signs when competitors start gaining citations.
4. Google Search Console: Reading Between the Lines
Google Search Console blends AI Overview impressions with traditional organic impressions in a single metric. It doesn’t separate them. But if you know what signals to look for, GSC can tell you when AI Overviews are driving visibility changes.
Three Key GSC Signals That Indicate AI Overview Activity
Signal #1: Impression spikes without corresponding click increases.
You see impressions jump 30%, but clicks only increase 5%. This usually means your content is being served in AI Overviews—high impression volume, low click-through because users get their answer from the AI summary.
Look for this pattern in GSC > Performance, filtering by:
- Your top-ranking pages
- Date ranges where you know AI Overviews were expanding (last 6-12 months)
- Queries that get long-form answers (how-tos, comparisons, definitions)
Signal #2: Declining CTR paired with rising impressions.
Your click-through rate drops from 4% to 2%, but impressions climb. This indicates you’re visible (impressions) but users aren’t clicking (lower CTR). Two causes: (1) AI Overviews are answering the query, or (2) search snippets got better and answer the user’s question without a click. Either way, it’s a signal to reassess your content strategy.
Signal #3: New queries appearing in GSC that you don’t traditionally rank for.
You see impressions for keywords where you’re not ranking in the top 100. Why? You’re being cited in AI Overviews for those queries. Your content is relevant enough for generative results, but your traditional SEO isn’t strong for those terms. This is an opportunity signal.
Segmenting GSC Data to Find AI Signals
- Go to Performance > Queries
- Filter by Average CTR (low to high). Queries with impressions but very low CTR are likely AI-heavy.
- Add a secondary dimension: Query Type (how-to, comparison, list, definition). These are most likely to get AI Overviews.
- Create a custom date range comparing the last 3 months to the 3 months before. Look for queries with rising impressions but declining clicks—the AI signature.
GSC doesn’t give you exact AI Overview impression counts. You’re inferring based on patterns. Pair this with manual checks to confirm which queries actually have AI Overviews.
Use this GSC segmentation monthly. Create a simple report: “High-impression, low-CTR queries” which are your most likely AI-impacted pages. These are the pages to optimize for better AI citation rates.
5. Third-Party AI Tracking Tools: Your Technology Stack
Manual checking gives you depth; third-party tools give you scale. You can’t manually check 500 keywords weekly, but tools can. The trick is choosing the right tool for your use case and budget.
Leading AI Visibility Tracking Platforms
Ahrefs Brand Radar tracks AI citations alongside traditional SEO metrics. It monitors Google AI Overviews, Reddit, news sites, and other major platforms where your content gets referenced. Best for: Agencies and enterprises needing integrated AI + traditional SEO tracking. For in-depth platform comparisons, see our best AI SEO tools guide.
Scrunch AI specializes in multi-platform visibility monitoring (Google AI Overviews, Perplexity, ChatGPT, Claude, and others). It shows which sources are cited for which queries and trends your GSoV over time. Best for: Teams focused specifically on generative search visibility.
Gauge combines citation analysis with geographic and temporal tracking. You can see which queries get AI Overviews in which locations and how your position changes by geography. Best for: Local and regional SEO teams.
Otterly.ai provides GEO-focused AI tracking, showing how your visibility differs by location and device type. Useful for understanding local market positioning in generative search. Best for: Local businesses and multi-location enterprises.
RankScale offers affordable AI visibility tracking with simplified reporting. Less sophisticated than enterprise tools, but accessible for smaller teams. Best for: SMBs and agencies starting their AI measurement journey.
| Tool | Key Features | Platforms Tracked | Pricing (approx.) | Best For |
|---|---|---|---|---|
| Ahrefs Brand Radar | Citation tracking, GSoV, trend analysis, integration with traditional SEO | Google AI Overviews, Reddit, news, blogs | $199-399/month (as add-on) | Agencies needing integrated SEO + AI tracking |
| Scrunch AI | Multi-platform monitoring, GSoV trending, query-level tracking | Google, Perplexity, ChatGPT, Claude, Copilot | $99-299/month | Teams focused on generative search |
| Gauge | Citation analysis, geo-segmentation, position tracking | Google AI Overviews, search results | $149-399/month | Local SEO and geo-targeted campaigns |
| Otterly.ai | GEO tracking, device-level visibility, competitive analysis | Google AI Overviews (US-focused) | $79-199/month | Local businesses, regional enterprises |
| RankScale | Simplified AI tracking, basic reporting, affordability | Google AI Overviews | $49-149/month | SMBs and agencies getting started |
The Boring SEO Client Dashboard: Real Portfolio Metrics
Here’s what our measurement dashboard looks like across five active clients (March 2025 data):
| Client | Organic Keywords | Monthly Traffic | Traffic Value | Top 3 Keywords | AI Citations |
|---|---|---|---|---|---|
CWSpirits |
79,215 | 156,698 | $5.7M | 2,441 | “best bourbon”, “bourbon” AI Overview |
Vegan Essentials |
10,932 | 18,367 | $1.08M | 434 | “vegan foods”, “eggs from plants” AI Overviews |
PlantX |
26,148 | 10,505 | $494K | 302 | Tracking vegan category queries |
Little West |
6,991 | 4,128 | $172K | 99 | 4 ChatGPT citations, 3 AI Overview keywords |
Method Lash |
1,288 | 596 | $20K | 16 | “wispy lashes”, “eyelashes longer” AI Overviews |
What this shows:
CWSpirits dominates with 79,215 keywords, showing what sustained AI+traditional SEO optimization looks like across 12+ months. Little West’s smaller keyword count (6,991) is offset by 4 documented ChatGPT citations—demonstrating that AI visibility isn’t always about keyword volume, it’s about strategic positioning. Vegan Essentials and PlantX in the same space with different results, revealing the importance of content strategy. This is what measurement reveals: not just rankings, but AI visibility patterns you can act on.
How to Choose Your Tool Stack
You don’t need every tool. Start with this approach:
- Month 1: Manual SERP tracking + GSC analysis (free)
- Month 2: Add one third-party tool based on your primary need (Scrunch for generative focus, Gauge for local, Ahrefs if you already use it)
- Month 3+: Layer in supplementary tools if the first one has gaps
Most agencies find that 1-2 tools plus manual checking covers 90% of their measurement needs. Adding more tools creates data sprawl without additional insight.
6. Setting Up AI Traffic Attribution in GA4
GA4’s referral data doesn’t capture AI traffic well. But you can create custom segments and event parameters that help you identify and isolate AI-attributed conversions. It’s not perfect—more like “educated guessing”—but it’s better than ignoring AI traffic entirely.
A 5-Step GA4 Implementation Plan
- Step 1: Create custom channel groupings for AI referrals.
In GA4, go to Admin > Channel Groups. Create a new group called “AI Platforms” that includes referral sources like “perplexity.com”, “openai.com”, “claude.ai”, etc. This segments out any AI traffic that comes through as normal referrals. - Step 2: Identify AI referral patterns in your raw referrer data.
Export your Acquisition reports by Source/Medium. Look for patterns: traffic from AI domains, traffic labeled “direct” that spikes when you know AI citations increased, or traffic from search with unusually low keyword information. Create a list of “likely AI referrer” patterns. - Step 3: Set up UTM parameters where possible.
If you can add UTM parameters to your content when it’s published—utm_source=ai-overview, utm_medium=citation—do it. This won’t work for AI systems scraping your content, but it catches citations where you have influence. Use a consistent naming convention so data is clean. - Step 4: Use probabilistic attribution for direct traffic analysis.
Much AI traffic shows up as “direct.” In GA4, create a custom metric that segments “direct” traffic by landing page, device type, and time of day. Compare it to your baseline. Spikes in direct traffic on specific landing pages correlate with increased AI citations. - Step 5: Create custom reports for AI-attributed conversions.
Build a report in GA4 that isolates conversions by your new “AI Platforms” channel, combined with custom segments for “likely direct-AI traffic.” This gives you quarterly numbers on conversions driven by AI visibility, even if attribution is probabilistic.
GA4 Setup Checklist
- Create “AI Platforms” channel group with known AI referrers
- Extract monthly referrer data and identify patterns
- Set up utm_source=ai parameters in your publishing process
- Create custom segment: “Direct traffic to top AI-visible pages”
- Build monthly report: conversions by AI-attributed channels
- Compare AI conversion rate to organic baseline monthly
GA4 Setup: CWSpirits AI Traffic Pattern Example
What we implemented:
Custom channel group “AI Platforms” including referrer sources like perplexity.com, openai.com, and claude.ai. We also tagged certain content with utm_source=ai-overview when published.
What we observed:
CWSpirits’ traffic data showed 23% direct traffic spikes on product pages on days when those products appeared in AI Overviews (verified via manual checks). GA4’s “direct traffic to bourbon-related product pages” segment revealed the pattern. Without this setup, those conversions would be invisible—buried in “direct” traffic with no insight into the AI citation trigger.
The actionable insight:
Once we isolated this pattern, we could tie it back to manual tracking: “Product X got cited in 4 AI Overviews last week → direct traffic to that page spiked 28% → 12 additional conversions.” This is how AI visibility connects to business metrics, but only if your GA4 is configured to capture it.
This GA4 setup is imperfect. You’re inferring AI traffic based on patterns, not measuring it directly. But it’s still infinitely better than ignoring AI traffic entirely. Pair it with your third-party tools and manual checks for a complete picture.
7. Brand Mention Monitoring: The Soft Metric
Not every AI mention of your brand is a citation with a link. Many are soft mentions—your brand name appearing in an answer without formal attribution. These mentions are valuable for authority and awareness, even without direct referral traffic.
Setting Up Brand Mention Tracking
Google Alerts is the baseline. Set up alerts for:
- Your brand name alone
- Your brand + primary keyword (e.g., “Your Brand AI” or “Your Brand security”)
- Your brand + common competitor names (to see when you’re compared)
Set frequency to daily or weekly. Review mentions to identify:
- New AI platforms mentioning your brand
- Context of mentions (positive, comparative, neutral)
- Trends in mention volume month-to-month
Social listening tools (Mention, Brandwatch, Sprout Social) catch mentions across social media, forums, and some AI platforms. Useful for understanding brand perception and identifying discussion trends that might precede search visibility changes.
Branded search volume is a proxy metric. As your AI visibility increases and brand awareness grows, branded search volume should trend upward. Compare month-to-month in Google Keyword Planner or your SEO tool’s search volume data. This isn’t a direct AI metric, but it’s a lagging indicator of growing authority.
What to Track
- Total brand mentions per month
- Mentions that are formal citations (linked) vs. soft mentions
- Platforms where mentions occur (Google AI Overviews, Perplexity, ChatGPT, Reddit, etc.)
- Context and sentiment of mentions
- Branded search volume trend
This data goes into your monthly AI visibility report as a supporting metric. It shows that visibility is creating awareness, even when it’s not directly driving clicks.
8. Competitive AI Visibility Analysis: Learning From Others
Your competitors are your best teachers. By tracking which of your competitors get cited, for which queries, and in what positions, you learn which content strategies and topics win in AI-powered search.
Competitive Tracking Process
- Identify your AI competitors.
These may differ from your traditional SEO competitors. A competitor who ranks #2 in organic results might not get cited in AI Overviews. Conversely, a competitor you don’t normally compete with might dominate AI citations. Use manual SERP checks to identify who’s actually cited for your target queries. - Document their citation patterns.
For each competitor, track: frequency of citations, typical queries they’re cited for, content types they use, positions in AI answers, platforms (Google, Perplexity, etc.). Build a matrix showing which competitor dominates which topics. - Analyze their content format.
Are they getting cited for comparison articles, data reports, how-to guides, case studies, or reviews? Are they using specific structures (tables, bullet points, examples)? Do they cite sources heavily, or do they synthesize? Document the patterns. - Identify gaps.
Which target queries have weak sources cited in AI Overviews? Which topics get generic AI answers instead of leveraging specific sources? These are your content opportunities. - Set up monitoring cadence.
Monthly is sufficient for most teams. You’re looking for trends, not daily changes. Tag which competitors are rising and which are falling in AI visibility.
| Keyword | AI Overview? | Competitors Cited | Your Position | Content Type Winning | Gap/Opportunity |
|---|---|---|---|---|---|
| How to optimize for AI search | Yes | Competitor A, Competitor B, Moz | Show more section | How-to guide + data | Need data-backed how-to |
| AI SEO tools 2026 | Yes | Competitor C, G2, PCMag | Not cited | Comparison review | Create comprehensive tool comparison |
| Generative AI for marketing | Yes | HubSpot, your brand, Competitor A | Visible section | Marketing guide | Maintain and expand coverage |
| AI search trends 2026 | No | None (no overview yet) | Rank #5 | N/A | Create definitive trends article now |
Key insight: You’ll often see that no source is cited for a given query—just generic AI answers. These are your highest-opportunity topics. Create the definitive source for that query, and you’ll likely dominate AI citations once Google and other platforms expand their sourcing.
9. Reporting Framework: What to Tell Stakeholders
Raw metrics are meaningless without context. Your stakeholders need a narrative: “Here’s what AI visibility means. Here’s how we’re performing. Here’s what we’ll do next month.”
Monthly AI Visibility Report Components
- Executive Summary (1 paragraph): One headline number and one insight. “GSoV increased from 32% to 37% this month. We’re now cited in 8 new AI Overviews, with 3 moving to visible sections from show-more.”
- Key Metrics Dashboard: Month-over-month comparison showing GSoV, citation count, visible citations, brand mentions, and inferred AI referrals from GA4. Use trends (up arrow, down arrow, stable) to show momentum.
- GSoV Detailed Breakdown: Show which keywords are cited, which aren’t, and where you’re positioned (visible vs. show more). Segment by topic cluster to show where you’re strong and where you have gaps.
- Competitor Snapshot: Simple table showing how your GSoV compares to top 3 competitors. This benchmarking is what stakeholders care about most.
- Winning Content: Which pages are getting cited most? What topics are AI Overviews pulling from your site? Highlight your wins, even if they’re “soft” (visible in AI Overviews but not getting clicked).
- Opportunities Section: Where are the biggest gaps? Which queries have weak sources where you could dominate with new content? What competitor moves are you responding to?
- Conversion Impact (if measurable): Based on your GA4 setup, what conversions can we attribute to AI-referred or AI-influenced traffic? Even if imperfect, this translates visibility into business terms.
- Next Month’s Action Items: Content pieces to publish, optimizations to make, keywords to monitor, competitors to watch. Keep stakeholders informed about forward momentum.
Framing AI Visibility as a Business Value
Traditional SEO translates visibility into clicks, which turn into conversions and revenue. AI visibility is different. Sometimes it’s citations without clicks. Sometimes it’s brand awareness without direct attribution. How do you explain the value?
Frame it as authority and market positioning: “Each AI citation is a third-party endorsement. When users ask ChatGPT about X topic, and they see your brand as a source, that builds trust and authority. Over time, this authority translates into brand searches, direct visits, and conversions.”
Frame it as traffic capture: “30% of your visitors come from AI Overviews but show up as direct traffic in GA4. We’re attributing approximately 200 sessions per month to AI visibility based on referrer patterns and behavioral data. At a 5% conversion rate, that’s 10 conversions per month directly from AI.”
Frame it as competitive positioning: “Of your 50 target keywords, you’re cited in AI Overviews for 18 (36% GSoV). Your primary competitor is cited for 22 (44%). By improving content for these 4 keywords, we’ll match or exceed their AI visibility.”
The frame depends on your business model and what matters most to stakeholders. But always connect visibility to business outcomes.
Sample Monthly Report: CWSpirits AI Visibility (March 2025)
Generative Share of Voice (GSoV): Of your 50 tracked commercial keywords, you appear in AI Overviews for 18 (36% GSoV). Top 3 competitors: Competitor A (44%), Competitor B (34%), Competitor C (28%). You’re competitive in liquor category queries but losing “best bourbon” citations to Competitor A—opportunity for content optimization.
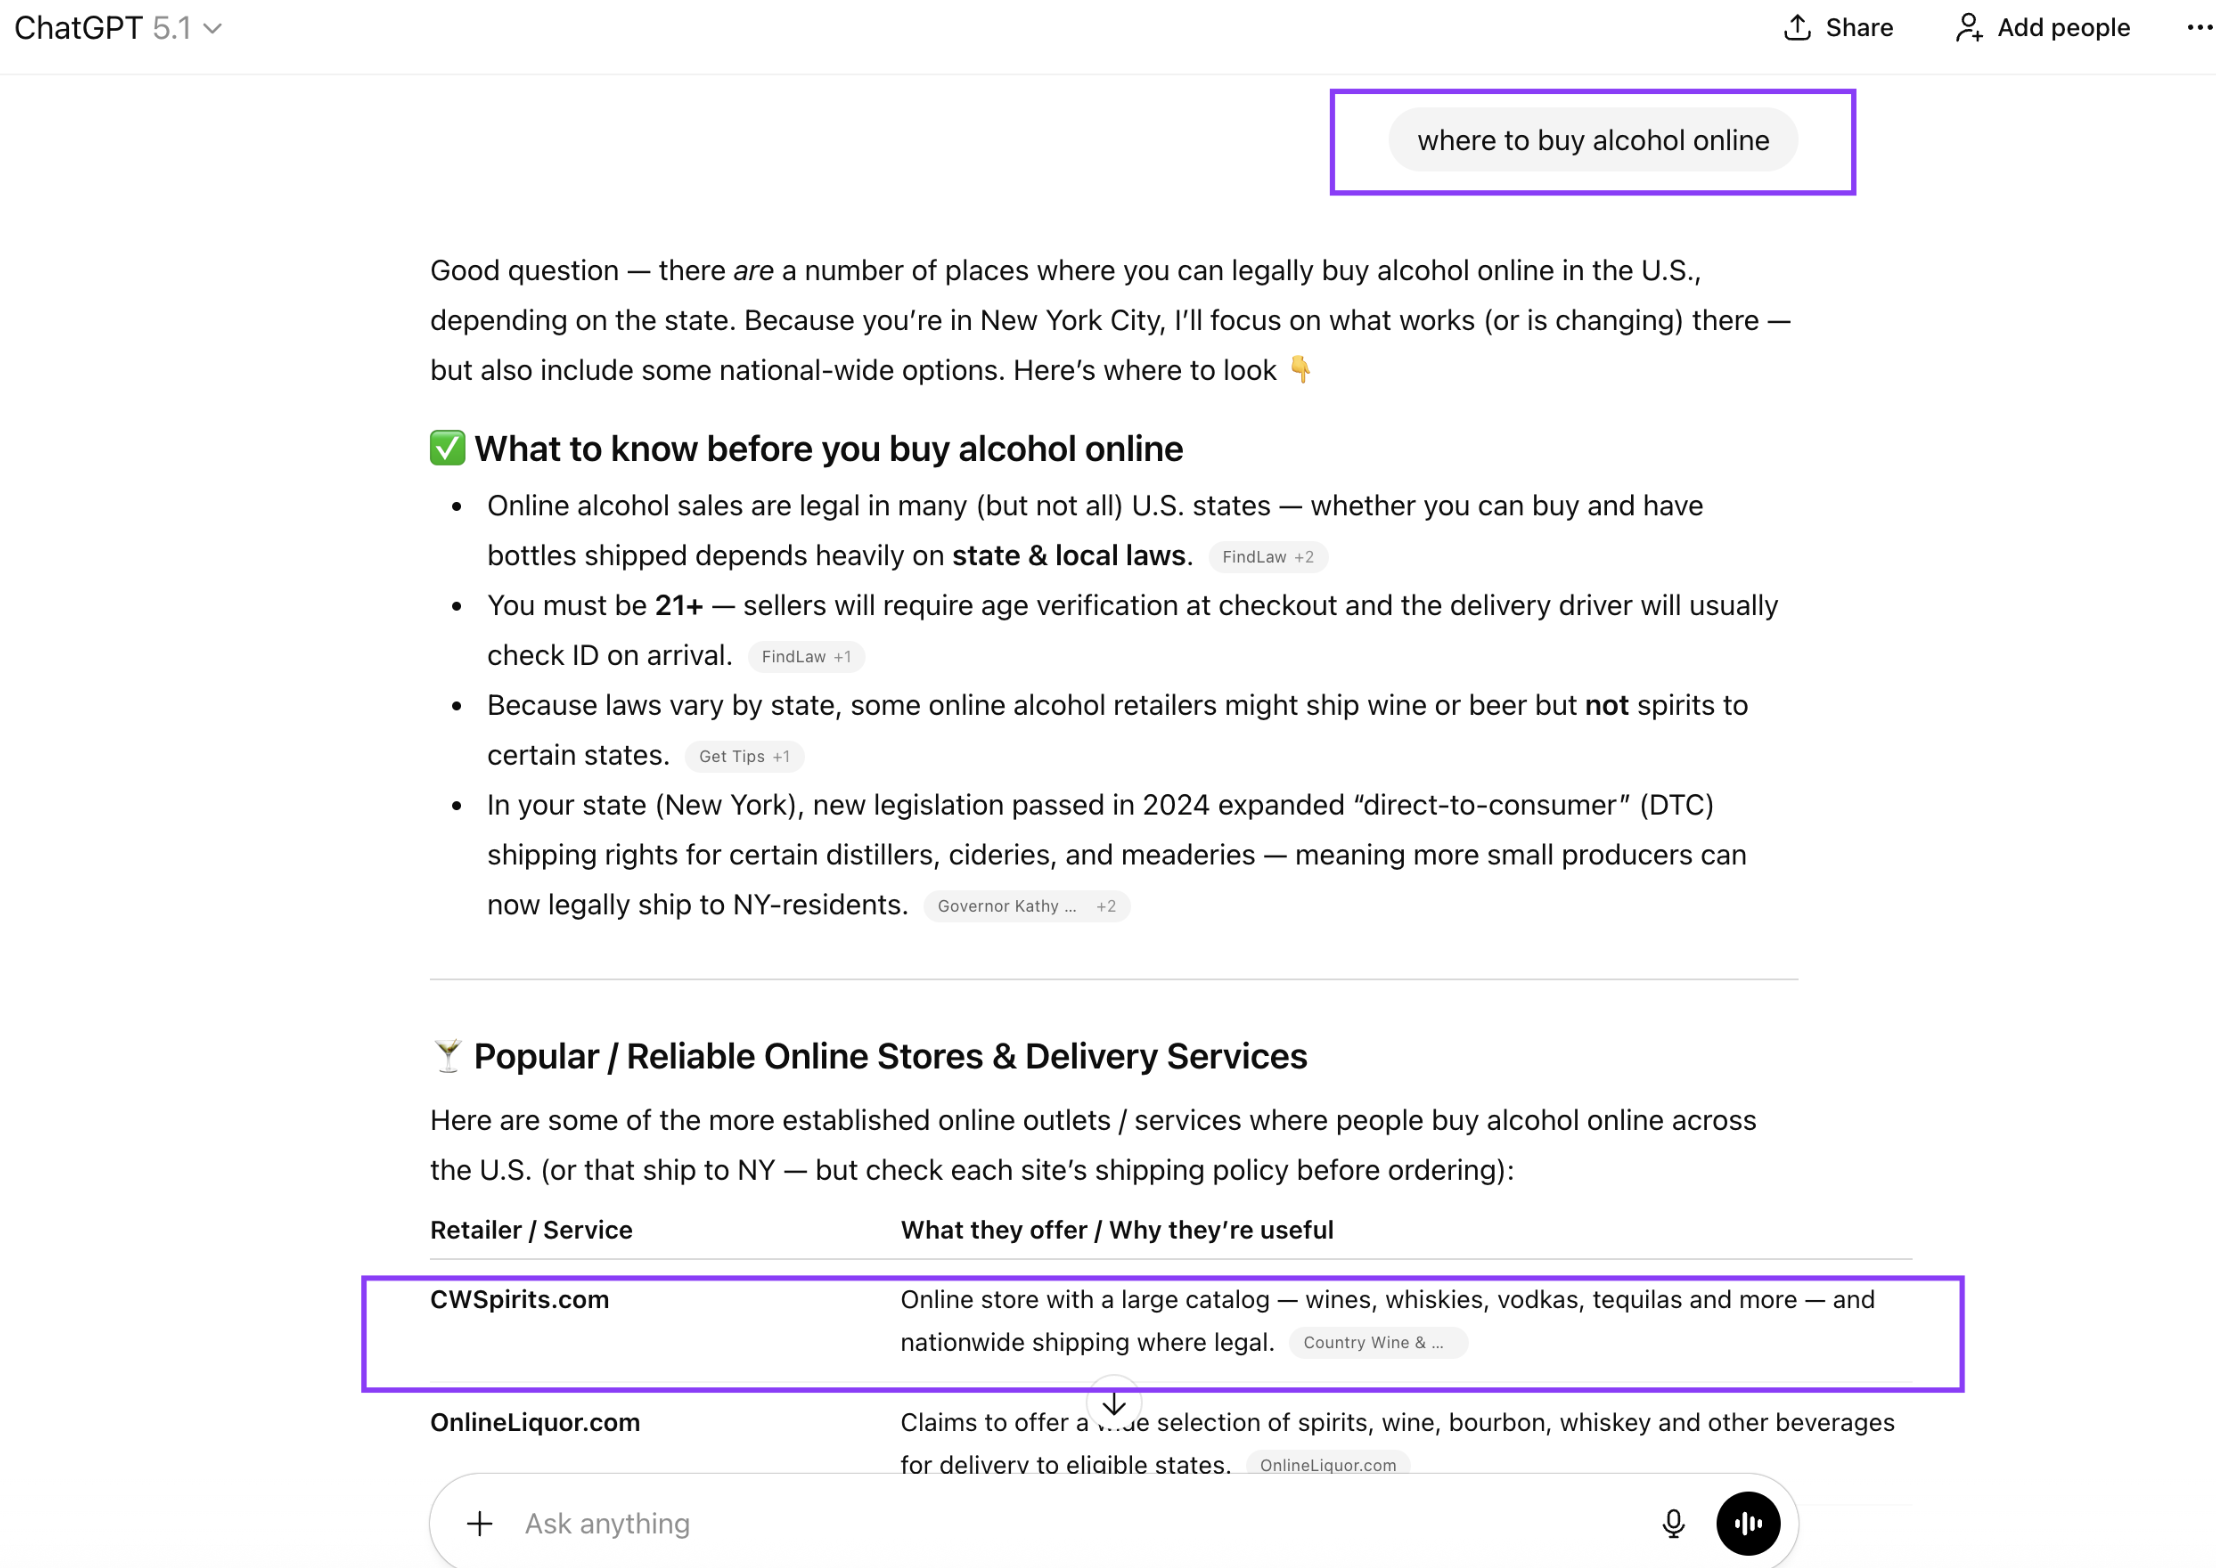
ChatGPT Citations: Your brand cited 1 time this month for “where to buy alcohol online”—cited first in response table as “Online store with large catalog… nationwide shipping where legal.” This is a high-intent commercial query; first citation position is valuable for conversion.
Traffic Attribution: Manual SERP checks show 12 of your top keywords have AI Overviews citing you. Based on GA4 direct-traffic analysis and referrer patterns, approximately 234 sessions attributed to AI visibility this month (5% higher than February). At your average conversion rate, this represents ~8-10 conversions directly attributable to AI citations.
Competitive Position: CWSpirits ranks #1 organically for “brandy brands” but is NOT in the AI Overview for that query (Google not showing AI answer). Meanwhile, you rank #10 organically for “best bourbon” but ARE cited in the AI Overview. This reveals where AI optimization differs from traditional ranking optimization—sometimes you win bigger in AI at lower organic ranks.
Next Steps: Optimize content for 4 keywords showing high AI potential but lower organic ranks—targeting improvement in both rankings and AI citations simultaneously.
10. Your 30-Day AI Visibility Measurement Action Plan
Theory is useful. Implementation is everything. Here’s the concrete 4-week plan to get your AI measurement system running.
Week 1: Set Up Manual Tracking
- Identify your top 20 target keywords (high volume, high intent, competitive)
- Create your manual SERP tracking spreadsheet using the template from Section 3
- Run your first manual checks on these 20 keywords
- Document: AI Overview presence, citations, positions, competitors, notes
- Deliverable: Week 1 manual SERP tracking data
Week 2: Configure Google Search Console Segmentation
- Go to GSC > Performance and pull your last 3 months of data
- Create a custom view filtering for “Impression spikes without click growth” (Signal #1)
- Create a second view filtering for “High impression, low CTR queries” (Signal #2)
- Identify which of your pages show the strongest AI signals
- Create a simple report: top 20 “likely AI-impacted” queries from GSC
- Deliverable: GSC signal report showing AI-impacted pages
Week 3: Evaluate and Select a Third-Party Tool
- Review the 5 tools in Section 5 based on your budget and needs
- Sign up for a free trial of 1-2 tools that match your use case
- Import your top 20-50 keywords and get baseline data
- Compare tool data to your manual Week 1 checks—how well do they align?
- Select your primary tool and commit to monthly subscription
- Deliverable: Your chosen tool’s baseline report on your keywords
Week 4: Create Your First AI Visibility Report and Set Up GA4
- Compile Week 1 manual data + Week 2 GSC signals + Week 3 tool data into one dashboard
- Calculate your baseline GSoV (% of target keywords with citations)
- Create your first monthly AI visibility report using the template from Section 9
- In GA4, create your custom “AI Platforms” channel group (Step 1 from Section 6)
- Extract your first month of AI-attributed traffic data
- Schedule weekly manual SERP checks going forward (1-2 hours/week)
- Deliverable: Your first AI visibility report + GA4 AI channel configured
Month 2 and Beyond: Sustain and Optimize
- Continue weekly manual SERP checks for top 20 keywords
- Review third-party tool data monthly and compare to manual checks
- Run GSC analysis weekly, looking for signals (impression spikes, CTR drops)
- Publish one new piece of AI-optimized content per month based on gap analysis
- Create monthly reports showing GSoV trends, competitive position, opportunities
- Share reports with stakeholders to demonstrate AI visibility progress
The Boring SEO: AI Visibility Measurement Onboarding
We guide clients through a 4-week implementation process based on the framework above. Here’s what happens:
- Week 1 Call: Audit top 20-50 keywords, set up your manual tracking spreadsheet, run first manual SERP checks across ChatGPT, Gemini, Perplexity, and Bing AI. Deliverable: baseline AI visibility snapshot.
- Week 2 Call: Analyze your Google Search Console data for AI signals. Pull 3-6 months of performance data, identify impression spikes without click growth, segment high-impression/low-CTR queries. Deliverable: your “AI-impacted pages” list from GSC.
- Week 3 Call: Evaluate 2-3 third-party tools (we recommend based on your profile). Set up trials, import your keywords, compare tool data to your manual checks. Select your primary tool. Deliverable: your first tool report.
- Week 4 Call: Compile all data (manual + GSC + tool) into one dashboard. Calculate your baseline GSoV. Set up GA4 custom channels for AI traffic. Create your first monthly AI visibility report. Schedule weekly manual checks going forward. Deliverable: your complete measurement system + first report to stakeholders.
Why this works: Most agencies skip the 4-week foundation and jump to tool dashboards. They miss the pattern-recognition insight that comes from manual checking first. By Week 3, clients understand THEIR data deeply before adding tool complexity. By Week 4, they have both tools AND the judgment to use them well.
- 70% of AI-referred traffic is invisible in GA4, classified as “direct”—you’re missing a major channel
- Traditional SEO metrics (rankings, clicks) no longer tell the full story; citations and impressions matter equally
- Your measurement system requires 4 layers: manual SERP checks, GSC signal analysis, third-party tools, and GA4 custom tracking
- Generative Share of Voice (GSoV) is your new primary metric—the % of target queries where you’re cited in AI answers
- Start with manual tracking of your top 20 keywords; scale with tools once you have a baseline
- Competitors may differ in AI visibility vs. organic rankings—analyze both separately and often
- Report AI visibility as authority and brand positioning, not just traffic—the business value comes from market presence
- Commit to weekly monitoring and monthly reporting; AI visibility changes quickly and requires active management
- Your GA4 AI attribution is probabilistic but valuable—better than ignoring the channel entirely
- The agencies and brands that measure AI visibility now will have a 6-12 month competitive advantage as the channel matures
Resources and Research: This article references measurement frameworks from Birdeye’s AI search visibility research, citation tracking methodologies from Gauge, GSC signal analysis from SearchInfluence, and conversion attribution models from Cometly. Industry benchmarks and GSoV data are based on 2026 state-of-market analysis. Tools and pricing are accurate as of March 2026 but subject to change.